Prometheus Node Exporter Installation Process
To install Node Exporter on Ubuntu 20.04 and configure it to collect Linux system metrics, such as CPU load and disk I/O, follow these steps. This process is similar to the Prometheus installation process:
- Create a system user for Node Exporter with the following command:
sudo useradd \
    --system \
    --no-create-home \
    --shell /bin/false node_exporter
- Download Node Exporter using the wget command from the same page as Prometheus:
exwget https://github.com/prometheus/node_exporter/releases/download/v1.6.1/node_exporter-1.6.1.linux-amd64.tar.gz
- Extract Node Exporter from the archive:
tar -xvf node_exporter-1.6.1.linux-amd64.tar.gz
- Move the Node Exporter binary to the /usr/local/bin directory:
sudo mv \
  node_exporter-1.6.1.linux-amd64/node_exporter \
  /usr/local/bin/
- Clean up by deleting the Node Exporter archive and folder:
rm -rf node_exporter*
- Verify that you can run the Node Exporter binary:
node_exporter --version
- Node Exporter offers various plugins that can be enabled. Use the following command to view all available options:
node_exporter --help
- Create a systemd unit file for Node Exporter:
sudo vim /etc/systemd/system/node_exporter.service
Here's the content of the node_exporter.service file:
[Unit]
Description=Node Exporter
Wants=network-online.target
After=network-online.target

StartLimitIntervalSec=500
StartLimitBurst=5

[Service]
User=node_exporter
Group=node_exporter
Type=simple
Restart=on-failure
RestartSec=5s
ExecStart=/usr/local/bin/node_exporter \
    --collector.logind

[Install]
WantedBy=multi-user.target
Replace the Prometheus user and group with node_exporter, and update the ExecStart command accordingly.
- 💡Make sure that you have removed the firewall restrictions for the 9100 port
To ensure Node Exporter starts automatically after a reboot, enable the service:
sudo systemctl enable node_exporter
- Start Node Exporter:
sudo systemctl start node_exporter
- Check the status of Node Exporter with the following command:
sudo systemctl status node_exporter
At this point, you have a single node in Prometheus. Prometheus offers various service discovery mechanisms, including dynamic discovery in cloud environments. In future tutorials, you can explore deploying Prometheus in cloud-specific environments or within Kubernetes clusters.
Now, Go back to the Node, where you have installed the Prometheus and perform the following steps
- To create a static target, edit the Prometheus configuration file:
sudo vim /etc/prometheus/prometheus.yml
Here's an example of adding a static target:
  - job_name: node_export
    static_configs:
      - targets: ["localhost:9100"]
By default, Node Exporter exposes metrics on port 9100.
- Since you enabled lifecycle management via API calls, you can reload the Prometheus configuration without service downtime. Before reloading, validate the configuration with promtool:
promtool check config /etc/prometheus/prometheus.yml
- Use a POST request to reload the configuration:
curl -X POST -u username:password http://localhost:9090/-/reload
- Check the "targets" section by navigating to http://:9090/targets to ensure that the static target is functioning correctly.
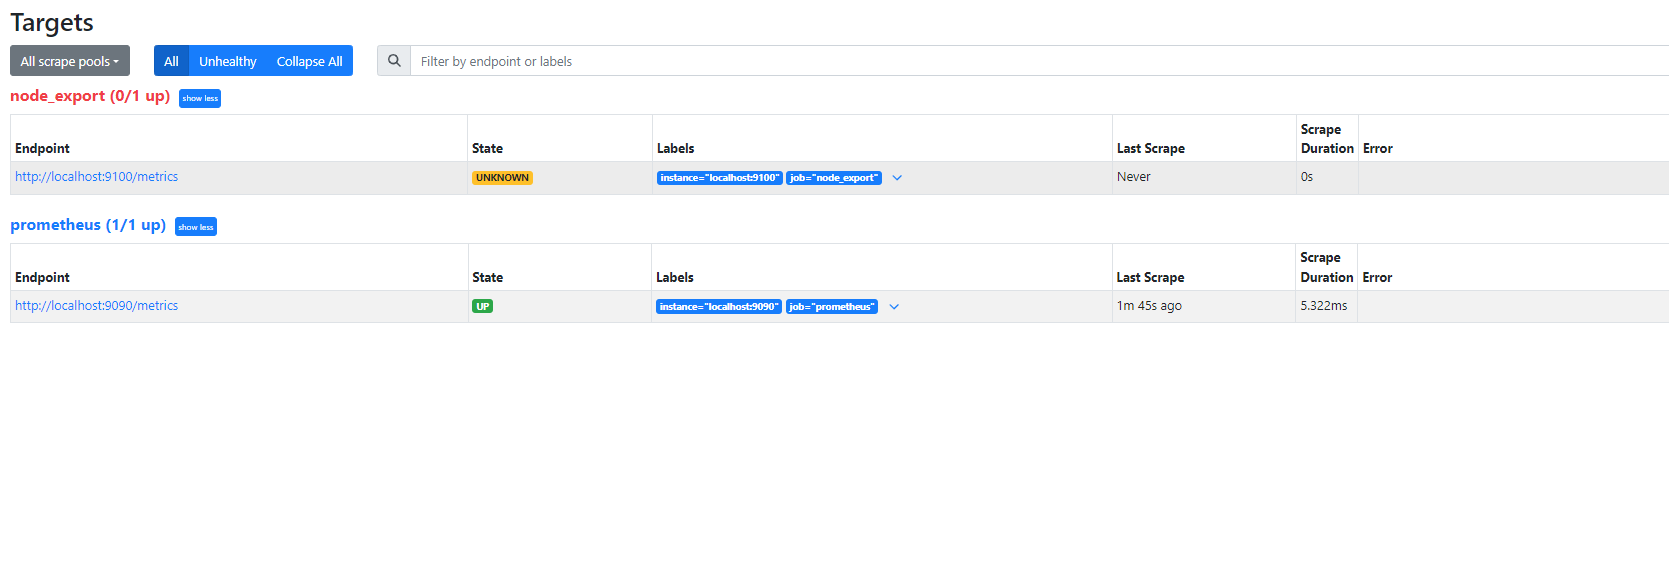
Perform the same process on all the nodes and connect to the Prometheus database.